0. Talktorials
모든 study 는 TeachOpenCADD 를 바탕으로 구성하였습니다.
T003 · Molecular filtering: unwanted substructures — TeachOpenCADD 0 documentation
Github:
1. Theory
1-1. Unwanted substructures
Substructures 는 unfavorable 할 수 있습니다.
[이유]
- toxic (독성)
- reactive (반응성이 높음)
- unfavorable pharmacokinetic properties (약동학적 특성이 불리함)
- they likely interfere with certain assays (특정 실험에서 간섭 있을 수 있음)
최근에 drug discovery 는 High Throughput Screening (HTS) 를 포함하는 경우가 많은데, unfavorable 한 substructures 를 사전에 filtering 하면, 더 효율적으로 screening 이 가능합니다.

Brenk et al. (Chem. Med. Chem. (2008), 3, 435-44) 는 neglected diseases 치료제 screening 을 위한 library 를 filtering 할 목적으로 unfavorable 한 substructures 를 정리했습니다.
[Substructures list]
- nitro groups (mutagenic)
- sulfates and phosphates (likely resulting in unfavorable pharmacokinetic properties)
- 2-halopyridines and thiols (reactive)
1-2. Pan Assay Interference Compounds (PAINS)
PAINS 는 HTS 에서 hit 물질로 나타나지만 실제로는 false positive 인 compound 입니다. Unspecific binding or interaction with assay components 때문에 특정 target 이 아니라 여러 target 에 activity 를 보입니다.
※ false positive: 한 compound 가 실제로는 activity 가 없는데, 실험 결과에서는 효과가 있는 것처럼 보이는 경우

2. Practical
2-1. Load and visualize data
- 이전 실습에 이어서 EGFR_compounds_lipinski.csv 를 load 합니다.
# load data from Talktorial T2
egfr_data = pd.read_csv(
    HERE / "../T002_compound_adme/data/EGFR_compounds_lipinski.csv",
    index_col=0,
)
# Drop unnecessary information
print("Dataframe shape:", egfr_data.shape)
egfr_data.drop(columns=["molecular_weight", "n_hbd", "n_hba", "logp"], inplace=True)
egfr_data.head()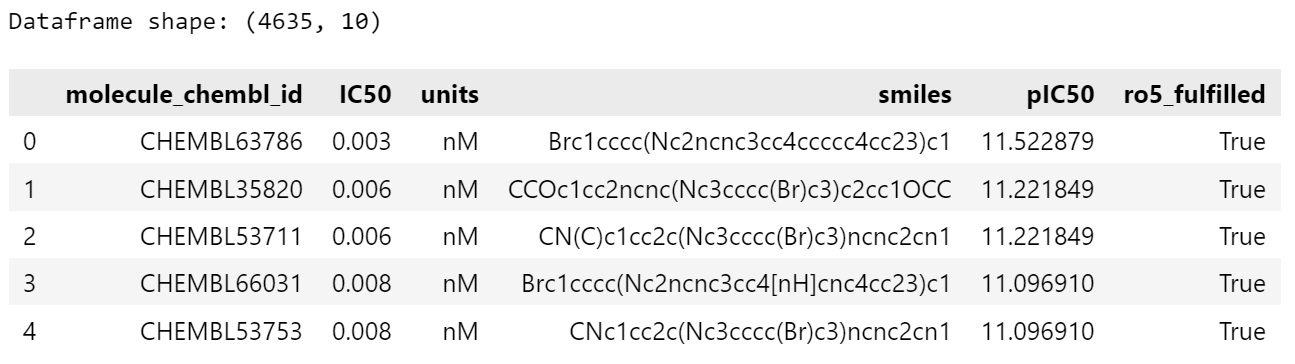
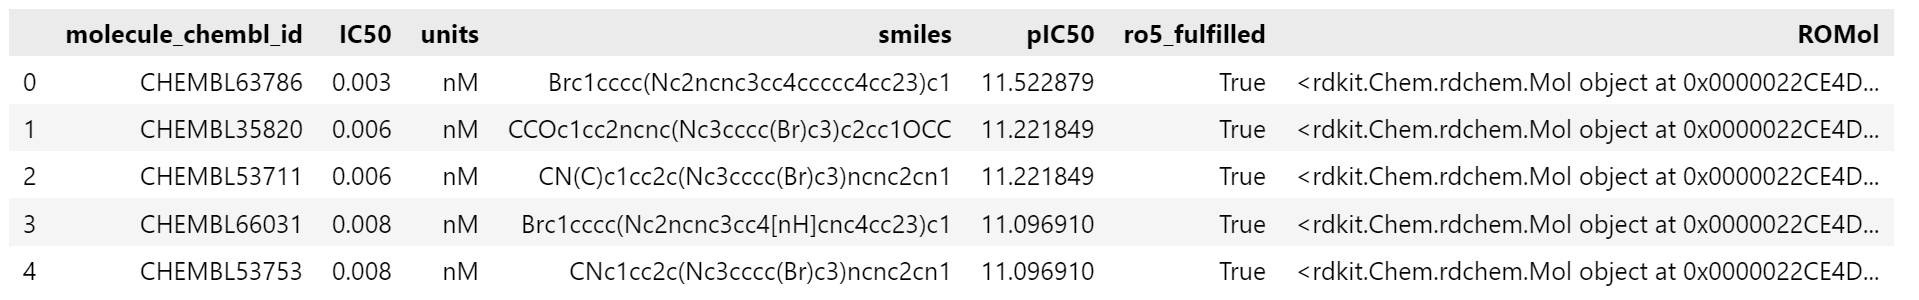
- RDKit 의 Pandas Tools 를 이용해서 SMILES 문자열을 Mol 객체로 변환해서 새로운 column 에 추가합니다. (SMILES 를 RDKit 에서 처리하기 위해 변환합니다.)
# Add molecule column
PandasTools.AddMoleculeColumnToFrame(egfr_data, smilesCol="smiles")
# Draw first 3 molecules
Chem.Draw.MolsToGridImage(
    list(egfr_data.head(3).ROMol),
    legends=list(egfr_data.head(3).molecule_chembl_id),
)
2-2. Filter for PAINS
- RDKit 에서 제공하는 함수들
- FilterCatalogParams(): filter 종류 정의
- AddCatalog(FilterCatalogParams.FilterCatalogs.PAINS): PAINS filter 적용
- catalog 생성
# initialize filter
params = FilterCatalogParams()
params.AddCatalog(FilterCatalogParams.FilterCatalogs.PAINS)
catalog = FilterCatalog(params)
- egfr_data 에서 PAINS substructure 를 포함한 분자들을 filtering
- matches 에 PAINS 가지는 compound 따로 저장
# search for PAINS
matches = []
clean = []
for index, row in tqdm(egfr_data.iterrows(), total=egfr_data.shape[0]):
    molecule = Chem.MolFromSmiles(row.smiles)
    entry = catalog.GetFirstMatch(molecule)  # Get the first matching PAINS
    if entry is not None:
        # store PAINS information
        matches.append(
            {
                "chembl_id": row.molecule_chembl_id,
                "rdkit_molecule": molecule,
                "pains": entry.GetDescription().capitalize(),
            }
        )
    else:
        # collect indices of molecules without PAINS
        clean.append(index)

matches = pd.DataFrame(matches)
egfr_data = egfr_data.loc[clean]  # keep molecules without PAINS

# NBVAL_CHECK_OUTPUT
print(f"Number of compounds with PAINS: {len(matches)}")
print(f"Number of compounds without PAINS: {len(egfr_data)}")
2-3. Filter and highlight unwanted substructures
- RDKit 에서도 PAINS 같은 unwanted substructures 목록을 제공해주지만, 외부 목록을 사용해서 filtering 할 수도 있습니다.
- Brenk et al. (Chem. Med. Chem. (2008), 3, 535-44).
substructures = pd.read_csv(DATA / "unwanted_substructures.csv", sep="\s+")
substructures["rdkit_molecule"] = substructures.smarts.apply(Chem.MolFromSmarts)
print("Number of unwanted substructures in collection:", len(substructures))
# NBVAL_CHECK_OUTPUT
# search for unwanted substructure
matches = []
clean = []
for index, row in tqdm(egfr_data.iterrows(), total=egfr_data.shape[0]):
    molecule = Chem.MolFromSmiles(row.smiles)
    match = False
    for _, substructure in substructures.iterrows():
        if molecule.HasSubstructMatch(substructure.rdkit_molecule):
            matches.append(
                {
                    "chembl_id": row.molecule_chembl_id,
                    "rdkit_molecule": molecule,
                    "substructure": substructure.rdkit_molecule,
                    "substructure_name": substructure["name"],
                }
            )
            match = True
    if not match:
        clean.append(index)

matches = pd.DataFrame(matches)
egfr_data = egfr_data.loc[clean]
# NBVAL_CHECK_OUTPUT
print(f"Number of found unwanted substructure: {len(matches)}")
print(f"Number of compounds without unwanted substructure: {len(egfr_data)}")

2-4. Highlight substructures
- SMARTS(SMiles ARbitrary Target Specification) 는 SMILES 의 확장으로 분자의 substructures 를 표현할 때, 데이터베이스에서 검색할 때 편리합니다.
to_highlight = [
    row.rdkit_molecule.GetSubstructMatch(row.substructure) for _, row in matches.head(3).iterrows()
]
Chem.Draw.MolsToGridImage(
    list(matches.head(3).rdkit_molecule),
    highlightAtomLists=to_highlight,
    legends=list(matches.head(3).substructure_name),
)

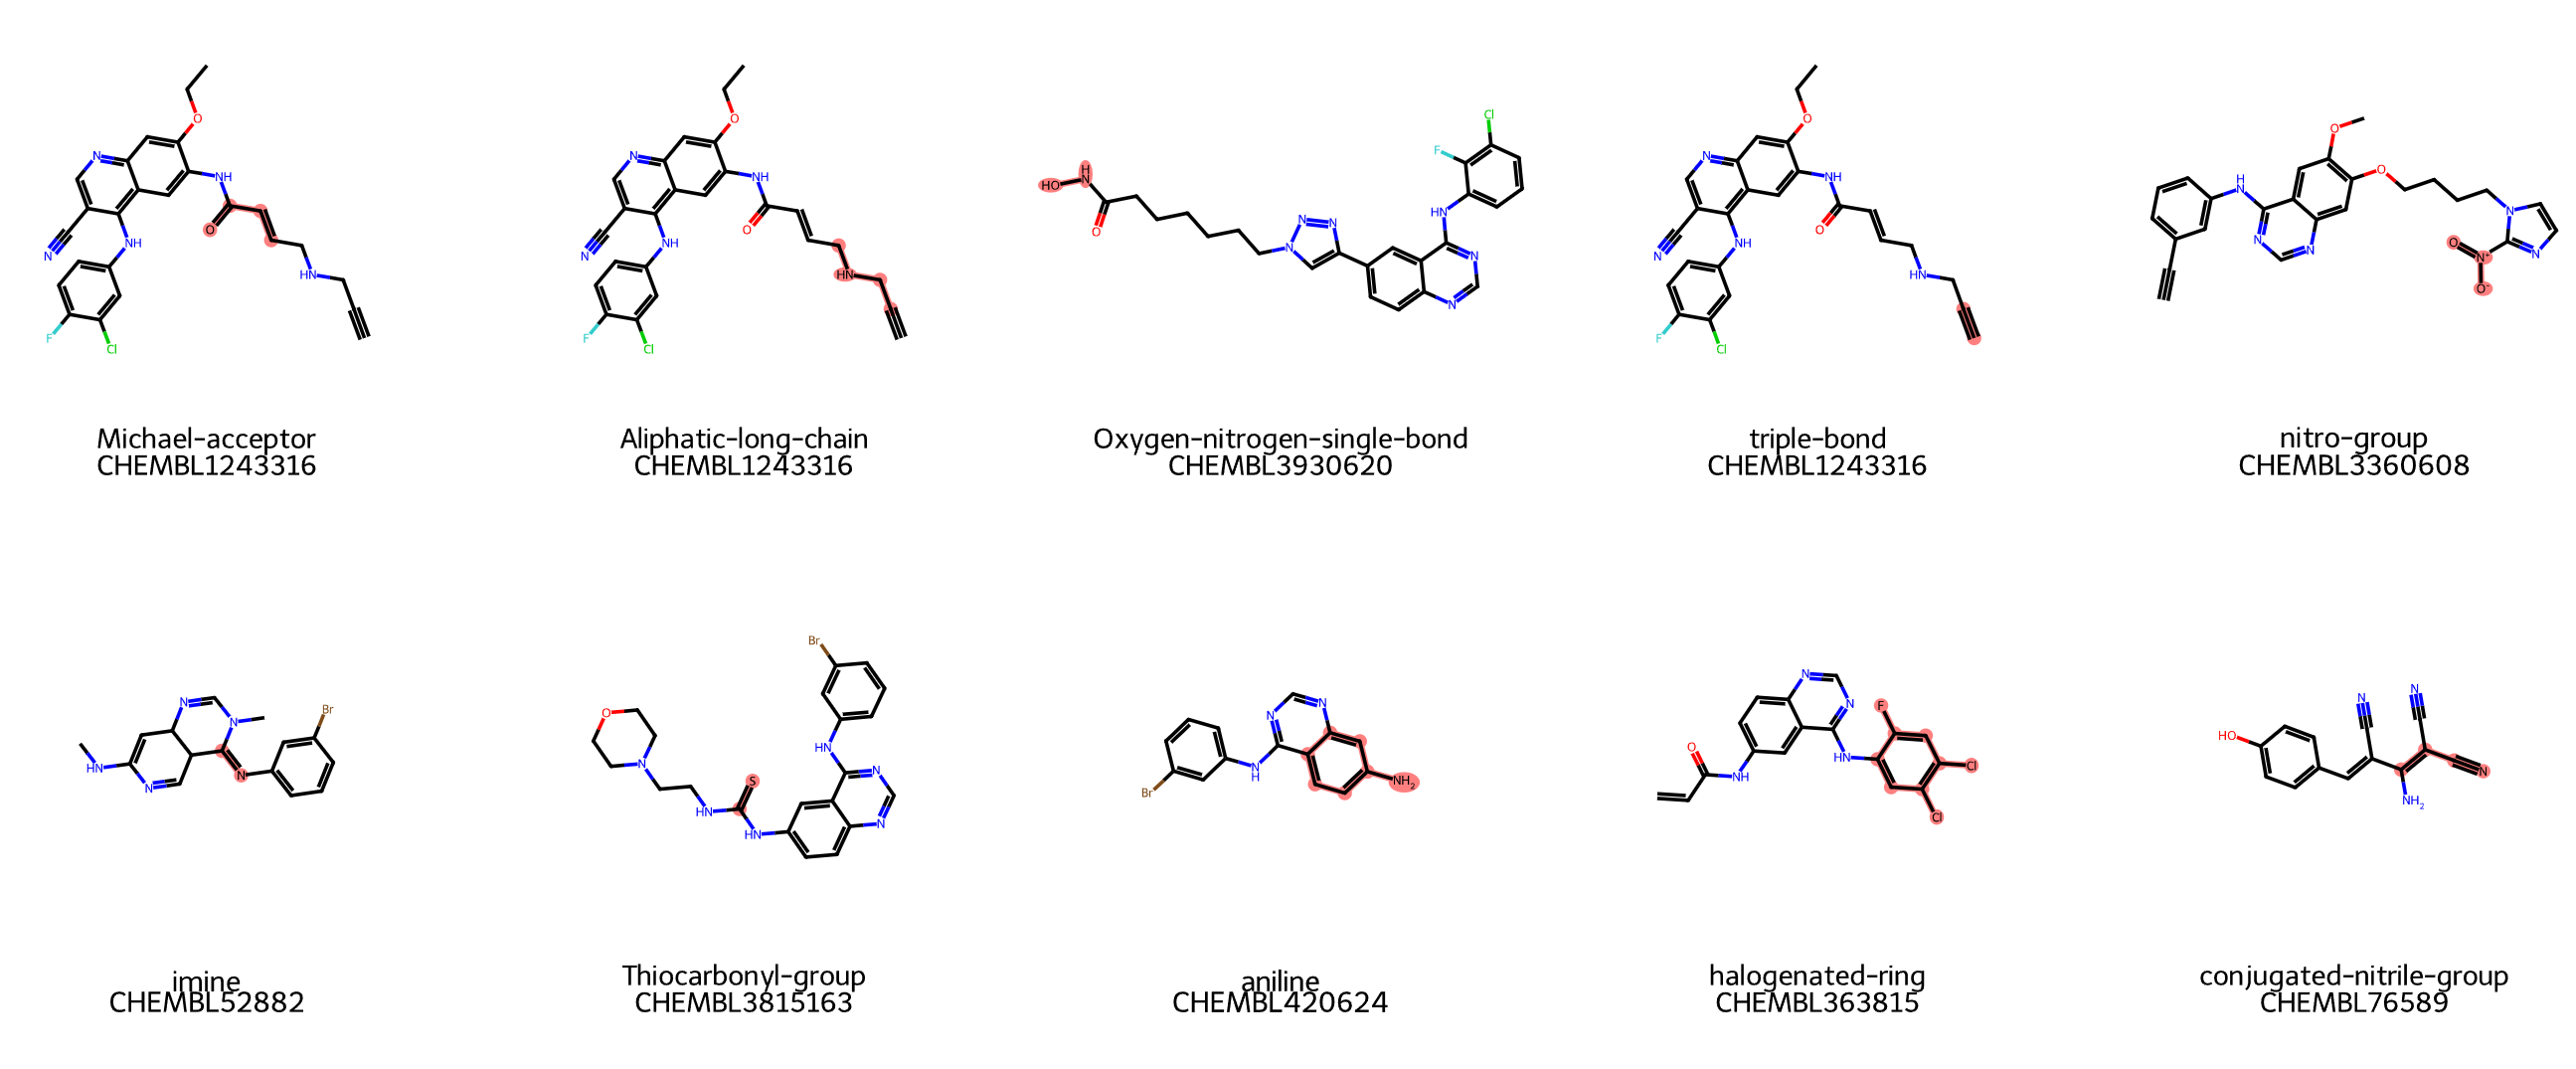
2-5. Substructure statistics
# NBVAL_CHECK_OUTPUT
groups = matches.groupby("substructure_name")
group_frequencies = groups.size()
group_frequencies.sort_values(ascending=False, inplace=True)
group_frequencies.head(10)
- 10 종류의 substructures 예시를 그림으로 살펴보기
from rdkit import Chem
from rdkit.Chem import Draw
from IPython.display import display

top_sub_names = [
    "Michael-acceptor",
    "Aliphatic-long-chain",
    "Oxygen-nitrogen-single-bond",
    "triple-bond",
    "nitro-group",
    "imine",
    "Thiocarbonyl-group",
    "aniline",
    "halogenated-ring",
    "conjugated-nitrile-group"
]

example_mols = []
highlight_atoms = []
legends = []


for name in top_sub_names:
    row = matches[matches["substructure_name"] == name].iloc[0]
    mol = row["rdkit_molecule"]

    smarts = substructures[substructures["name"] == name]["smarts"].values[0]
    sub_mol = Chem.MolFromSmarts(smarts)

    match_atoms = mol.GetSubstructMatch(sub_mol)

    example_mols.append(mol)
    highlight_atoms.append(match_atoms)
    legends.append(f"{name}\n{row['chembl_id']}")


img = Draw.MolsToGridImage(
    example_mols,
    highlightAtomLists=highlight_atoms,
    legends=legends,
    molsPerRow=5,
    subImgSize=(300, 300),
    useSVG=True
)

display(img)
Reference
- Brenk, R., Schipani, A., James, D., Krasowski, A., Gilbert, I. H., Frearson, J., & Wyatt, P. G. (2008). Lessons learnt from assembling screening libraries for drug discovery for neglected diseases. ChemMedChem: Chemistry Enabling Drug Discovery, 3(3), 435-444.
- https://en.wikipedia.org/wiki/Pan-assay_interference_compounds
- volkamerlab/teachopencadd: TeachOpenCADD: a teaching platform for computer-aided drug design (CADD) using open source packages and data
- 현재 관련 분야를 공부하고 있는 전문가가 아닌 학생이기 때문에 틀린 내용이 있을 수 있습니다.
- 오타와 틀린 부분을 댓글로 알려주시면 수정하도록 하겠습니다.
'Drug study > TeachOpenCADD' 카테고리의 다른 글
| T006 · Maximum common substructure (0) | 2025.05.07 |
|---|---|
| T005 · Compound clustering (0) | 2025.04.18 |
| T004 · Ligand-based screening: compound similarity (2) | 2025.04.16 |
| T002 · Molecular filtering: ADME and lead-likeness criteria (0) | 2025.04.07 |
| T001 · Compound data acquisition (ChEMBL) (0) | 2025.04.07 |